RF & Wireless An
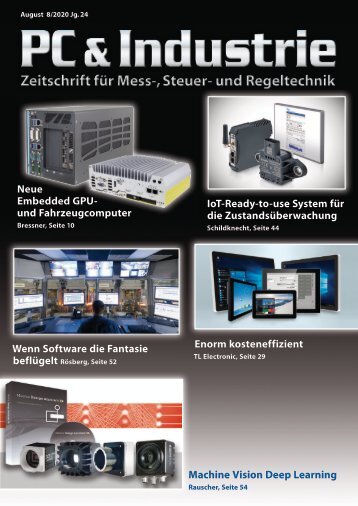
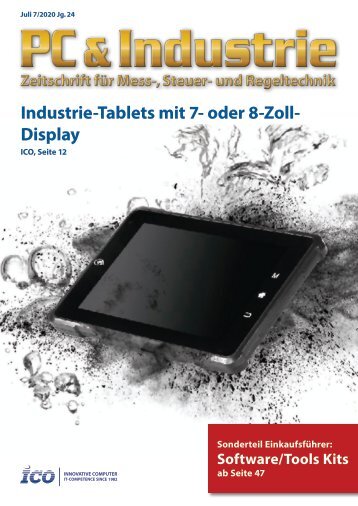
RF & Wireless An Integrated Framework for Complex Radar System Design Figure 1: VSS main radar system diagram, showing linear chirp source, RF transmitter and receiver links, target and propagation model, and receiver baseband signal processing blocks. Modern radar systems are complex and depend heavily on advanced signal processing algorithms to improve the detection performance of the radar. At the same time, the radio front end must meet the specifications that are often a combination of available devices, implementation technologies, regulatory constraints, requirements from the system, and signal processing. This application example showcases how NI AWR Design Environ ment software and National Instruments LabVIEW and PXI instruments can be used together to design, validate, and prototype a radar system. This integrated framework provides a unique avenue for digital, RF, and system engineers to collaborate on complex radar system design. Step 1: Radar System Design in VSS National Instruments/ AWR 20125 www.ni.com Open ‘Pulse_Doppler_Radar_ System.emp‘ in NI AWR Design Environment software. The main radar system diagram (Figure 1) shows the following: the linear chirp source, the RF transmitter and receiver, and the target and propagation models, as well as the receiver baseband signal processing blocks, including moving target indicator (MTI), moving target detector (MTD), and constant false alarm rate (CFAR). • Linear chirp generator The linear chirp pulse source consists of basic parameters that can be configured according to user specifications, such as pulse repetition frequency (PRF), pulse duty cycle, start/stop frequency, and sampling frequency. • RF transmitter/receiver These subcircuits define the single stage upconverter and downconverter. Users may replace these subcircuits with their particular Implementations. • Target and propagation models This subcircuit models the propagation channels between TX/ RX antennas and the radar target. Users may specify the distance and relative velocity of the target, their RCS and RCS fluctuations, and also model jammers and clutter that are often present in radar systems. • Receiver baseband signal processing The MTI is used to remove stationary objects, the MTD is used to identify the remaining moving target, and the CFAR performs a sliding average to ensure that the detected signal is greater than a set threshold. Click on Run/Stop System Simulators to begin the simulation (Figure 2). Once the simulation is complete, your results should look like Figure 3. • Antenna pattern The radial plot shows the combined transmit and receive antenna pattern. When the simulation is run for the first time, the antenna parameters PHI and THETA are swept to obtain this data (see also antenna pattern VSS diagram for the swept variable setting). • Chirp waveform The time-domain graph shows the transmitted pulse, received pulse, and the pulse after the transmit/receive correlation. The correlator output is used in the baseband-received signal processing blocks to turn it into useful target information. • MTI output The time-domain plot shows the output of the MTI, which uses a second-order delay line canceler to remove effects of stationary clutter and leave Doppler information in the signal. • System metrics The graph shows the detected speed, Doppler, probability of detection (PoD), radar cross section (RCS), and the distance across multiple pulses. Step 2: Co-simulating with LabVIEW VSS enables RF designers to combine the front-end circuit with the LabVIEW-based signal processing building blocks in order to examine the effects Figure 2: Click Run/Stop System Simulators to begin the simulation. 42 hf-praxis 10/2015
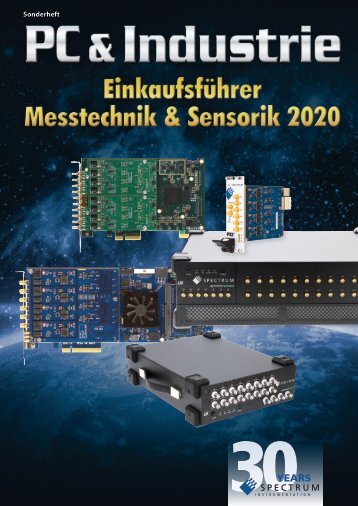
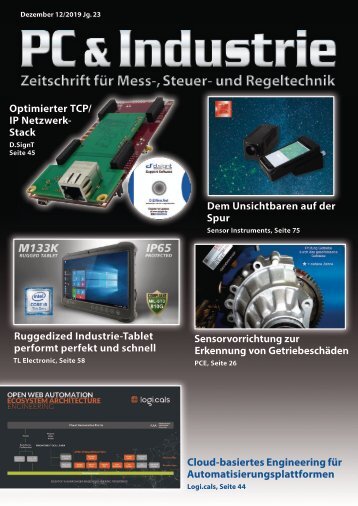
RF & Wireless Figure 3: VSS simulation results, including antenna pattern (top right), chirp waveform (top left), MTI output (lower left), and system metrics (lower right). Figure 4: LabVIEW block configuration within VSS simulation. of circuit change to the overall system performance metrics. The LabVIEW block provides access to an extensive LabVIEW signal-processing library, as well as to RF instruments and field-programmable gate arrays (FPGAs). This opens up possibilities for IP sharing (between simulation and prototype), hardware in the loop, cross verification, and partial prototyping. FPGA emulation, and hardware in the loop through modular instrumentation. Open ‘Pulse_Doppler_Radar_ System_LV2014_AWRv12. emp‘ using NI AWR Design Environment. Also, open the related visual interfaces (Vis); ‘MTD_2014.vi‘, and ‘CFAR_2014.vi‘ in LabVIEW 2014 or later. The VSS block diagram contains LabVIEW blocks that perform the MTD and CFAR operations. Run the simulation as before. Note that this simulation can take longer, depending on the CPU. The LabVIEW block configuration should look like Figure 4. Click on ‘Run/Stop System Simulators‘ to begin the simulation, as was done in Step 1. The LabVIEW VI has been invoked and started upon the VSS simulation. The overall signal flow is: 1. The linear chirp signal is generated in VSS. 2. The IQ samples are processed through the RF transmitter, target model, RF receiver, and correlator. 3. The output of the correlator, the compressed pulse, and the IQ samples are passed to the MTI, where the contributions of stationary clutter are removed. 4. The IQ samples are then passed to the MTD_2014.vi, where the MTD is performed with 32-point fast Fourier transform (FFT). 5. The detection result is passed through the CFAR_2014.vi, which determines whether a target is present using a threshold calculated from the input samples and the desired PoD. Figure 5 shows the expected results in VSS and Figure 6 the results of the IQ samples passed to the MTD.vi, including a 3D graph showing the peak corres- Figure 5: Results of VSS LabVIEW co-simulation. For DSP designers, VSS provides an environment to examine the LabVIEW (or m- or c-based) radar algorithms with realistic RF front-end blocks. The ability to access LabVIEW in VSS provides opportunities to include more complex IP in LabVIEW, Mathscript (textual math interpreter in LabVIEW), LabVIEW hf-praxis 10/2015 43