RF & Wireless Test &
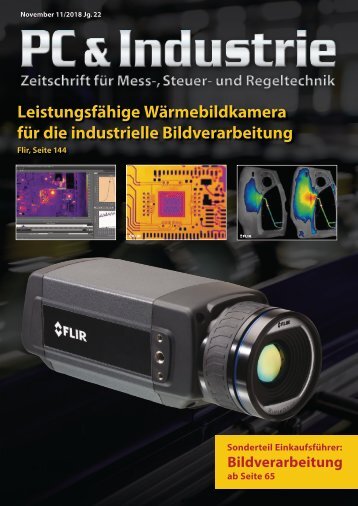
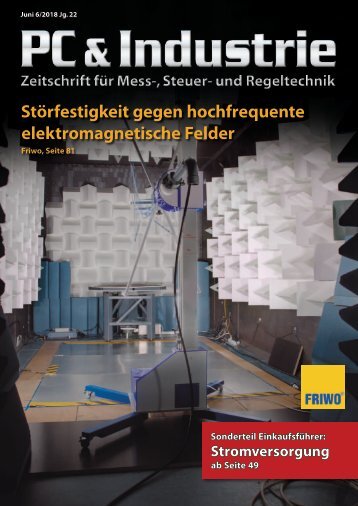
RF & Wireless Test & Measurement Simulating and Testing of Signal Processing Methods for Frequency Stepped Chirp Radar Part 2: Generating a Frequency-Swept Chirp Example Figure 5: Illustration of the frequency ramp & windowed pulse timing to generate the FSCR IQ waveform A stepped chirp can be derived from a continuous chirp, but the pulses gate the frequency ramp as shown in Figure 5. In practice, the pulses can be modified with a window function, rather than using simple rectangular pulses. A Kaiser window is used in this example, and the data will show a more efficient spectral footprint. Authors: Frank Raffaeli Principal RF/microwave Engineer, NI Trang D. Nguyen Master Project Manager, NI With complex waveforms, it is easier to realize the system using an Arbitrary Waveform Generator (AWG). The pulses gate the IQ sweep generation of the AWG. Note the pulse shaping in time domain due to the Kaiser window function. For the programming example in figure 6, LabVIEW Mathscript is chosen because its syntax is familiar to DSP programmers. The input parameters “wn” and “Ns” correspond to the window smoothing factor and the number of frequency steps. Next, let’s compare the modeled spectrum of the FSCR signal to the measured spectrum. They both show nearly 15 dB suppression between frequency bins, an ultimate out-of-band rejection of at least 40 dB relative to any frequency peak and more than 66 dB relative to the total channel power of -26 dBm. In theory, each of the five spectral components will also share power equally, since the maximum spectral energy for each pulse is centered on its frequency at the time of the chirp. Parseval’s Theorem states: Figure 6: Mathscript code to verify the FSCR theoretical model and program the AWG 34 hf-praxis 9/2016
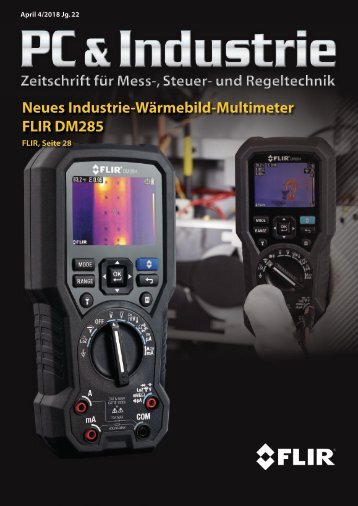
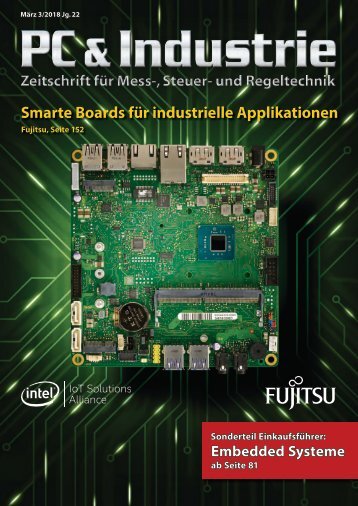
RF & Wireless Figure 7: Comparison of the spectral power in one frequency bin vs. the total Where energy per pulse, NP = number of pulses, and NB = number of frequency bins. NP = NB. So the integrated power in the frequency bins should equal the sum of the power of all the pulses. By extension, assuming each pulse has a unique frequency, each pulse’s energy in the frequency domain will be equally weighted and will be equal to 1/Ns of the total energy. Let’s check the measurement in Figure 7. The measured power in the central 20 MHz portion of the FSCR spectrum is -32.71 dBm and the entire spectrum measures -25.9 dBm. The measured power ratio is: P 20 /P 100 = 10 (-32.71-[-25.9])/10 = 0.208 ≅ 1/5 Figure 8 compares the measured spectral efficiency due to the Kaiser windowing of the pulse envelope. The windowed version shows nearly a 20 dB improvement in the adjacent channel. Modern radar systems are more complex due to signal processing algorithms designed to eliminate false detections, to identify multiple targets and to span multiple sensors. At the same time, the system should be designed for maximum spectral efficiency and dynamic range. FSCR systems are signal processing intensive, so it is imperative to model the hardware and numerical algorithms to achieve these goals. The front end receiver of radar systems can be replaced with instrumentation which enables validation of target detection schemes. Using VSS, the PXI Platform and wideband VSAs in conjunction, an advanced radar system can be created. Reference: 1) K. Pourvoyeur, R. Feger, S. Schuster, A. Stelzer, L. Maurer, Ramp Sequence Analysis to Resolve Multi-target Scenarios for a 77-GHz FMCW Radar Sensor 2) Alexiev, K and Bojilov, L, A Hough Transform Track Initiation Algorithm for Multiple Passive Sensors, Bulgarian Science Fund, Grant No. I-801/98 3) https://awrcorp.com/download/faq/english/examples/ Pulse_Doppler_Radar_System. aspx Figure 8: Measured result of Kaiser windowed (left) vs. rectangular pulses (right) hf-praxis 9/2016 35